January 27, 2023
2023 Outlook - International Equities

We continue our cautious approach toward international (Europe, U.K., Japan) equities from 2022 into 2023. Analysts and strategists generally agree that continued slowing in economic growth, persistently high inflation, an ongoing energy crisis, and hawkish central bankers’ activity will lead to a recession in 2023.
The combined effects of elevated prices and rising rates negatively impacts both consumers and corporations. From the consumer perspective, rising costs of goods such as food and energy, and higher borrowing costs reduce disposable income. Likewise, witness a similar impact to corporate financial statements. A reduction in consumer spending results in a reduction of sales and revenues, while the higher input costs contribute to margin compression. The combined effect of slowing revenue and reduced margins results in an earnings contraction.
An argument could be made that much of this negative outlook has already been priced into the market. International equities, with the U.K. in particular, trade at the lowest levels in a decade, as seen in graph 1 below.
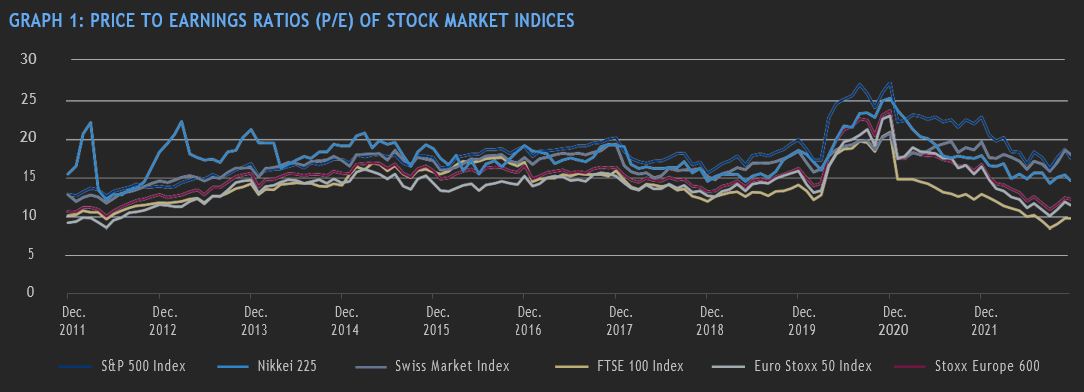
Source: Bloomberg Finance L.P. as of December 22, 2022.
*Associated with CI Global Investments Inc., a firm registered with the U.S. Securities and Exchange Commission and an affiliate of CI Global Asset Management.
While global valuations have compressed, the squeeze has been greatest outside the U.S. Some of this can be attributed to the structural differences between the composition of U.S. indices and non-U.S. indices. Notably, the greater weighting of technology and “growth” stocks in the U.S. indices as compared to their representation in the international benchmarks. Because of this difference, the U.S. has tended to trade at a premium to non-U.S. markets. Even so, despite the expectations of a U.S. recession in 2023, the valuation discount between U.S. and non-U.S. companies is substantial. Below, we can see this difference. U.S. stocks remain above their longer- term averages, while European stocks trade at a discount to their average levels.
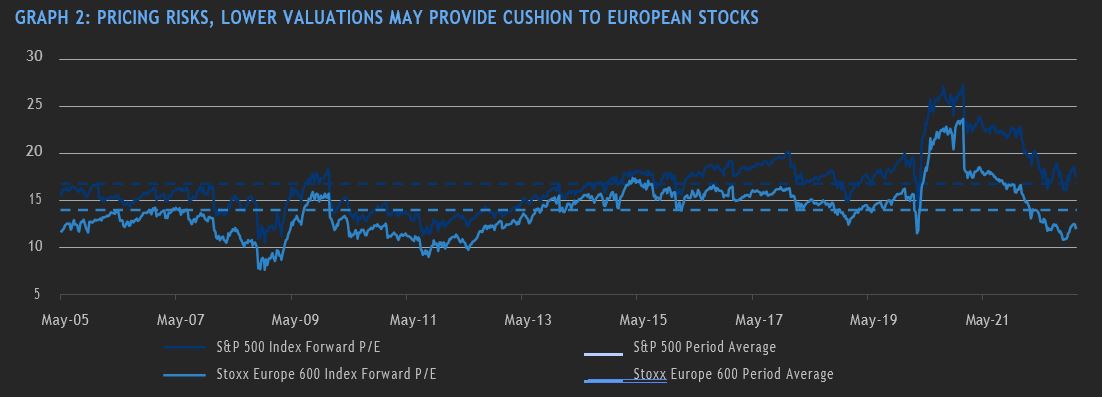
Source: Bloomberg Finance L.P. as of December 22, 2022.
This valuation differential had not gone unnoticed, as European stocks have outperformed U.S. stocks over the last quarter of 2022, potentially reversing a prolonged period of underperformance dating back to the mid 2000s.
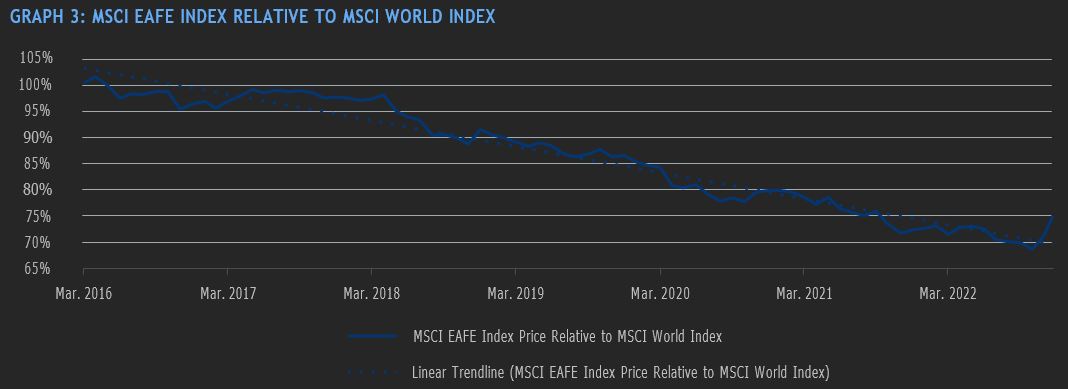
Source: Bloomberg Finance L.P. as of December 22, 2022. Monthly returns from March 31, 2016.
Valuation differentials weren’t the only source of investor enthusiasm however. The earnings growth rate of Euro area stocks was greater than that of the U.S. The prospects of an earnings recovery and lower valuations justified the increased allocation to these markets.
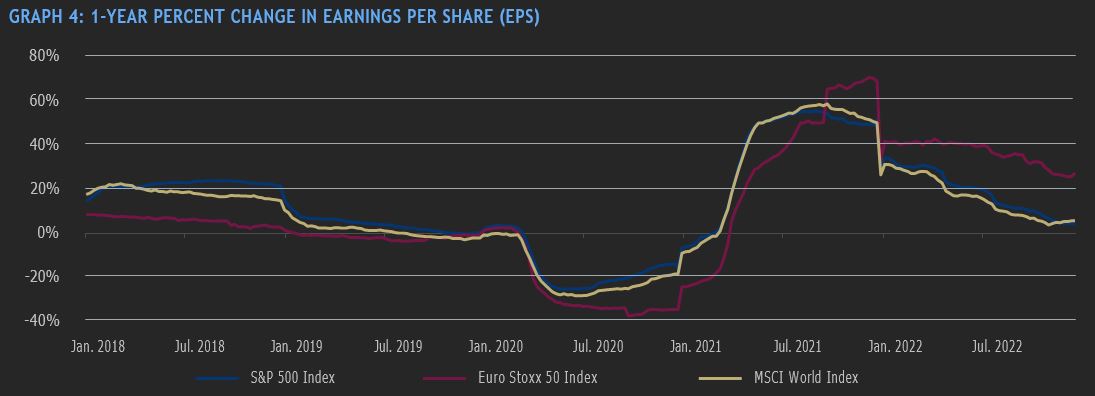
Source: Bloomberg Finance L.P. as of December 22, 2022.
More recently, however, the renewed hawkishness of the Bank of England, the European Central Bank (ECB), and the Bank of Japan have called into question the ability of these markets to continue their recent outperformance. The recent rate increases, and the accompanying hawkish rhetoric, has extended the duration of the projected economic slowdown and may lead to a deeper drawdown than previously expected. We see in graph 5 below that the market had priced in some of the expected earnings contraction.
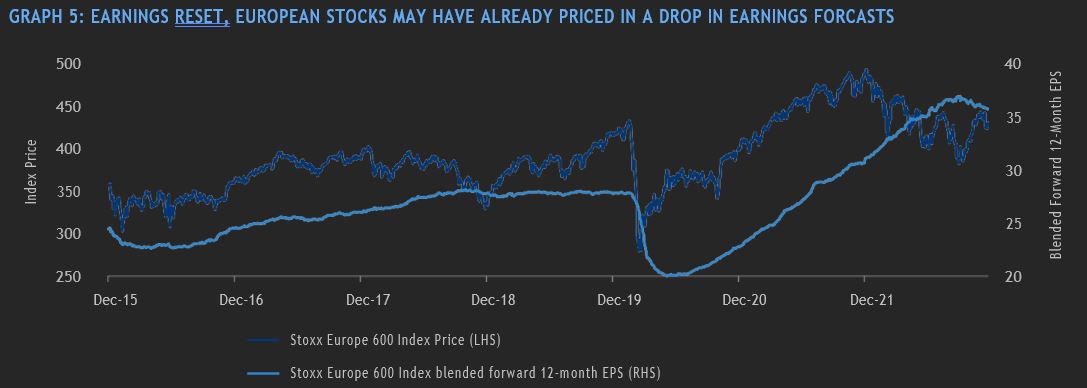
Source: Bloomberg Finance L.P. as of December 22, 2022.
Factoring in the recent rate increases, the ongoing conflict in Ukraine, and the persistent effects of rising costs, we would expect to see additional reductions in earnings expectations in the early part of 2023. Given sustainably higher rates, it is unlikely that valuation multiples expand in the first half of the year. Thus, with reduced earnings expectations and stable to contracting multiples, we would expect a challenging start to the year. The depth and duration of the economic and market contraction will be debated as the year begins.
There are, however, some potential positives that may accrue as the year progresses. At the top of the list would be a resolution of the war in Ukraine. Easing of inflationary pressures which may lead to a pause, if not a pivot, by central bankers would fuel enthusiasm for equities and other risk assets. One potential positive of the impact of the war has been the reshaping of global relationships for many companies. Given the strength of the dollar and the weakness in demand from China, European exports to the U.S. have increased substantially. The reshaping of supply chains and trading partners has resulted in a more resilient business model for many companies. An eventual full re-opening of China should unleash a wave of spending and investment. In the second half of 2023, investor focus may shift from a focus on recession to a subsequent recovery and an uptick of economic activity. Given the current low positioning in international equities by global investors and the attractive valuations on both an absolute and relative basis, we could see a substantial recovery in asset prices by year end.
Overall, while the outlook for international stocks in 2023 is uncertain, there are many reasons to remain optimistic. Many companies continue to have resilient business models and growing end markets creating the potential for attractive returns in the coming year.
GLOSSARY OF TERMS:
Correlation: A statistical measure of how two securities move in relation to one another. Positive correlation indicates similar movements, up or down, while negative correlation indicates opposite movements (when one rises, the other falls).
Credit rating/risk – An assessment of the creditworthiness of a borrower in general terms or with respect to a particular debt or financial obligation. Credit risk is the risk of default on a debt that may arise from a borrower failing to make required payment.
Drawdown: Measures the peak-to-trough decline of an investment or, in other words, the difference between the highest and lowest price over a given timeframe.
Duration – A measure of the sensitivity of the price of a fixed income investment to a change in interest rates. Duration is expressed as number of years. The price of a bond with a longer duration would be expected to rise (fall) more than the price of a bond with lower duration when interest rates fall (rise).
Leverage – An investment strategy of using borrowed money – specifically, the use of various financial instruments or borrowed capital – to increase the potential return of an investment.
Return (absolute) – The measure of what an investment returned over a given time period. An investment that rose from $1,000 to $1,100 would have an absolute return of 10%.
Return (relative) – The performance of one investment versus another. The most commonly reported relative returns are mutual fund returns relative to their benchmark indexes.
Volatility – Measures how much the price of a security, derivative or index fluctuates. The most commonly used measure of volatility when it comes to investment funds is standard deviation.
Yield Curve - A line that plots the interest rates of bonds having equal credit quality but differing maturity dates. A normal or steep yield curve indicates that long-term interest rates are higher than short-term interest rates. A flat yield curve indicates that short-term rates are in line with long-term rates, whereas an inverted yield curve indicates that short-term rates are higher than long-term rates.
About the Author

Robert Swanson, Senior Vice President and Co-Head of Equities – Portfolio Management at CI Global Asset Management (CI GAM), is a seasoned finance professional with over 40 years in investment management. Robert plays a pivotal role in managing the firm's equity portfolio management team in addition to driving its international equity strategies. Before joining CI GAM in 2011, Robert was a lead portfolio manager at Fidelity Investments. His tenure at Fidelity Investments showcased his abilities to manage large-scale funds and navigate complex financial systems. In terms of education, Robert holds a Bachelor of Science in Finance from Northern Illinois University and an MBA from Northwestern University. His academic credentials also include the Chartered Financial Analyst (CFA) designation, further demonstrating his knowledge and commitment to financial analysis and ethics.
IMPORTANT DISCLAIMERS
This document is provided as a general source of information and should not be considered personal, legal, accounting, tax or investment advice, or construed as an endorsement or recommendation of any entity or security discussed. Every effort has been made to ensure that the material contained in this document is accurate at the time of publication.Market conditions may change which may impact the information contained in this document. Individuals should seek the advice of professionals, as appropriate, regarding any particular investment. Investors should consult their professional advisors prior to implementing any changes to their investment strategies.
The opinions expressed in the communication are solely those of the authors and are not to be used or construed as investment advice or as an endorsement or recommendation of any entity or security discussed.
Certain statements in this document are forwardlooking. Forward-looking statements (“FLS”) are statements that are predictive in nature, depend upon or refer to future events or conditions, or that include words such as “may,” “will,” “should,” “could,” “expect,” “anticipate,” “intend,” “plan,” “believe,” or “estimate,” or other similar expressions.
Statements that look forward in time or include anything other than historical information are subject to risks and uncertainties, and actual results, actions or events could differ materially from those set forth in the FLS. FLS are not guarantees of future performance and are by their nature based on numerous assumptions. Although the FLS contained herein are based upon what CI Global Asset Management and the portfolio manager believe to be reasonable assumptions, neither CI Global Asset Management nor the portfolio manager can assure that actual results will be consistent with these FLS. The reader is cautioned to consider the FLS carefully and not to place undue reliance on FLS. Unless required by applicable law, it is not undertaken, and specifically disclaimed that there is any intention or obligation to update or revise FLS, whether as a result of new information, future events or otherwise.
The author and/or a member of their immediate family may hold specific holdings/securities discussed in this document. Any opinion or information provided are solely those of the author and does not constitute investment advice or an endorsement or recommendation of any entity or security discussed or provided by CI Global Asset Management.
Certain statements contained in this communication are based in whole or in part on information provided by third parties and CI Global Asset Management has taken reasonable steps to ensure their accuracy. Market conditions may change which may impact the information contained in this document.
©CI Investments Inc. 2023. All rights reserved. Published January 4, 2023

About Us
Contact
- 15 York Street, 2nd floor
Toronto, ON M5J 0A3 - Phone: 416‑364‑1145 or
Toll-free: 1‑800‑268‑9374