August 29, 2022
The bull case for Chinese equity ETFs

Emerging markets like China offer enticing risk/return profiles for investors. Despite the difficulty of discounting the political risk inherent in the Chinese market, investors have poured money into Chinese equity ETFs, with substantial inflows of US $5.8 billion recorded throughout June.
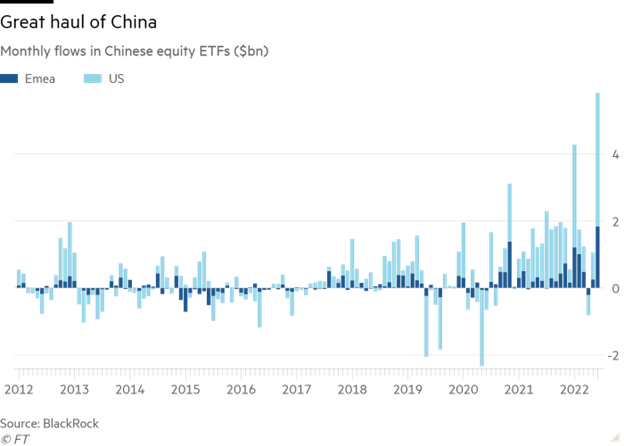
While the Chinese market was hard-hit in the first half of 2022 as a result of the country's "Zero-COVID" policies and the systemic risk from the Evergrande credit crisis, relief is now on the way. COVID regulations are once again easing, and the government crackdown on the tech sector has been abating.
Investing in Chinese equities could be suitable for investors seeking less correlated returns compared to U.S. and international developed markets. Other reasons for investing in the Chinese market include:
- Taking advantage of the relative under-representation of Chinese equities in world stock market indices.
- Investing in comparatively undervalued securities in contrast with U.S. and international developed equities that trade at higher valuations.
Under-representation presents opportunities
Most investors tend to allocate North American or international developed (European, Japanese) equities in their portfolio according to world market-capitalization weights. For example, an allocation to 60% U.S equities is in line with its weighting in worldwide market indices.
Not so for emerging market equities like China, which tend to be under-weighted in world market indices, especially when compared relative to its gross domestic product (GDP). Looking at its counterparts:
- The U.S. accounts for 24% of the world's GDP, but is weighted in world stock market indices at 60%.
- Japan accounts for only 5% of the world's GDP, but constitutes nearly 6% of most world stock market indices.
Not so for China, which comprises 19% of the world's GDP, yet most global equity indices allocate less than 5% to Chinese equities.
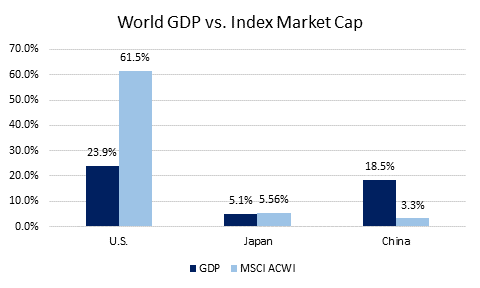
Source: World Bank and MSCI, as of December 31, 2021.
The velocity of Chinese GDP growth also implies that by 2030, China is expected to surpass the U.S. as the world's largest economy. From a forward growth potential standpoint, the spread between Chinese GDP and global equity index allocations represents a fantastic opportunity for investors. Current investors who invest worldwide are likely under-allocated to Chinese equities.
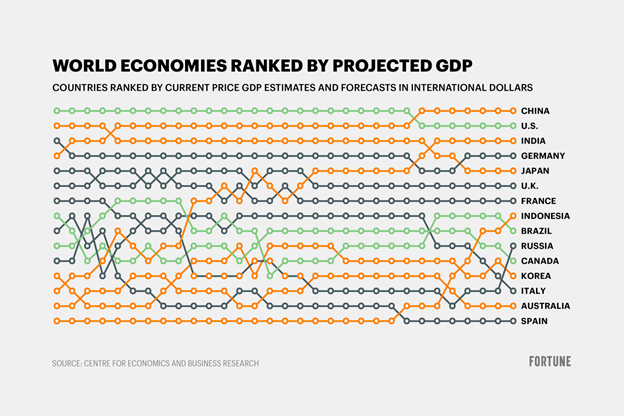
Source: World Bank and MSCI, as of December 31, 2021.
Attractive valuations
From a valuation perspective, Chinese equities trade fall below the price-to-earnings (P/E), price-to-book (P/B), and price-to-sales (P/S) multiples seen in global equities:
| MSCI China | MSCI ACWI | |
| P/E | 11.50 | 16.22 |
| P/B | 1.29 | 2.44 |
| P/S | 1.07 | 1.72 |
Bloomberg, as of July 21, 2022.
A commonly cited rationale for avoiding Chinese equities is the difficulty of pricing in geo-political risk. Proponents of this theory believe that Chinese equities trade in value range because they are "value traps", and often point to the historical under-performance of Chinese equities relative to U.S. markets.
This does not factor in the reality that many large-cap Chinese equities are currently trading close to the bottom of their historical range. For opportune investors willing to tolerate higher volatility, the current under-valuation could be a good entry point to take advantage of a long-term recovery and resurgence.
A better approach to Chinese equity ETFs
Investing directly in Chinese equities necessitates the use of depository receipts or China H-Shares, which are traded on Hong Kong exchanges. The primary limitation of these approaches is under-representation of numerous Chinese market sectors relative to their true weights. We see a heavy overweight to financials, while all other sectors are underweighted.
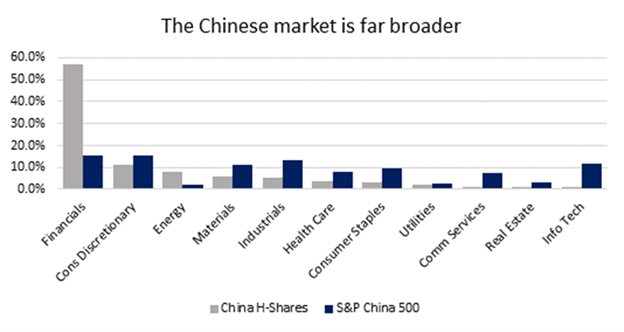
Source: S&P and MSCI, as of June 30, 2022. China H-Shares based on the MSCI China H Index.
Most of these under-represented companies are A-Shares, which are listed and traded only on mainland Chinese exchanges. Existing Chinese indexes like the MSCI China A do not offer sufficient exposure to these companies and thus may underweight crucial sectors relative to their true allocations.
In contrast, the CI ICBCCS S&P China 500 Index ETF (TSX: CHNA.B) tacks the S&P China 500 Index, which provides exposure to the largest, most liquid Chinese equities across all Chinese share classes including both A-shares and offshore listings. The benefit of this is a more diversified weighting across other burgeoning sectors compared to other indices:
"New China" Sectors | Information Technology | Industrials | Consumer Discretionary | Consumer Staples | Health Care | Communication Services | Total |
S&P 500 China | 11.8% | 13.5% | 15.4% | 9.8% | 7.9% | 7.7% | 66.1% |
MSCI China | 5.9% | 5.6% | 30.8% | 5.9% | 5.9% | 18.1% | 72.1% |
MSCI China A | 12.9% | 16.0% | 6.9% | 16.9% | 8.9% | 1.1% | 62.9% |
CSI 300 | 14.9% | 15.8% | 8.3% | 15.3% | 8.2% | 1.3% | 63.7% |
FTSE China A50 | 4.9% | 11.7% | 8.6% | 32.2% | 6.2% | 0.0% | 63.6% |
Source: S&P, MSCI, FTSE and CSI, as of June 30, 2022.
Investing in emerging market foreign equities like Chinese stocks can pose liquidity and diversification challenges for retail investors due to their inaccessibility. A one-ticker solution like CHNA.B solves this by ensuring balanced exposure to the largest, most liquid Chinese equities of all share classes.
For a low management fee of 0.55%, CHNA.B alleviates investors the need to convert currency or utilize depository receipt. This is highly competitive with existing emerging market ETFs available and saves investors the need to rebalance, account for dividends, and manage their portfolios. For more information, visit CI ICBCCS S&P China 500 Index ETF's details.
About the Author

Jaron Liu is a Director of Investment Advisory at CI GAM where he covers the firm’s sub-advised strategies. He serves as a key liaison between the portfolio managers and the sales team, shaping strategy, refining sales positioning, and delivering competitive insights. Prior to joining CI GAM, Jaron worked as an analyst within product management for one of the largest global asset managers where he focused on the firm’s ETF business. Jaron graduated from the University of Waterloo with a degree in Honours Economics and is a CFA Charterholder.
IMPORTANT DISCLAIMERS
Commissions, management fees and expenses all may be associated with an investment in exchange-traded funds (ETFs). You will usually pay brokerage fees to your dealer if you purchase or sell units of an ETF on recognized Canadian exchanges. If the units are purchased or sold on these Canadian exchanges, investors may pay more than the current net asset value when buying units of the ETF and may receive less than the current net asset value when selling them. Please read the prospectus before investing. Important information about an exchange-traded fund is contained in its prospectus. The indicated rates of return are the historical annual compounded total returns net of fees and expenses payable by the fund (except for figures of one year or less, which are simple total returns) including changes in security value and reinvestment of all dividends/distributions and do not take into account sales, redemption, distribution or optional charges or income taxes payable by any securityholder that would have reduced returns. ETFs are not guaranteed; their values change frequently, and past performance may not be repeated.
This document is provided as a general source of information and should not be considered personal, legal, accounting, tax or investment advice, or construed as an endorsement or recommendation of any entity or security discussed. Every effort has been made to ensure that the material contained in this document is accurate at the time of publication. Market conditions may change which may impact the information contained in this document. All charts and illustrations in this document are for illustrative purposes only. They are not intended to predict or project investment results. Individuals should seek the advice of professionals, as appropriate, regarding any particular investment. Investors should consult their professional advisors prior to implementing any changes to their investment strategies.
Certain statements contained in this communication are based in whole or in part on information provided by third parties and CI Global Asset Management has taken reasonable steps to ensure their accuracy. Market conditions may change which may impact the information contained in this document.
Certain statements in this document are forward-looking. Forward-looking statements (“FLS”) are statements that are predictive in nature, depend upon or refer to future events or conditions, or that include words such as “may,” “will,” “should,” “could,” “expect,” “anticipate,” “intend,” “plan,” “believe,” or “estimate,” or other similar expressions. Statements that look forward in time or include anything other than historical information are subject to risks and uncertainties, and actual results, actions or events could differ materially from those set forth in the FLS. FLS are not guarantees of future performance and are by their nature based on numerous assumptions. Although the FLS contained herein are based upon what CI Global Asset Management and the portfolio manager believe to be reasonable assumptions, neither CI Global Asset Management nor the portfolio manager can assure that actual results will be consistent with these FLS. The reader is cautioned to consider the FLS carefully and not to place undue reliance on FLS. Unless required by applicable law, it is not undertaken, and specifically disclaimed that there is any intention or obligation to update or revise FLS, whether as a result of new information, future events or otherwise.
CI Global Asset Management is a registered business name of CI Investments Inc.
©CI Investments Inc. 2022. All rights reserved.
Published August, 18, 2022

About Us
Contact
- 15 York Street, 2nd floor
Toronto, ON M5J 0A3 - Phone: 416‑364‑1145 or
Toll-free: 1‑800‑268‑9374