January 27, 2023
2023 Outlook - Small Cap Equity

It is our belief that small cap equities present a generational opportunity as we enter 2023. Small caps significantly lagged large caps in 2022 due to a perceived flight to safety. The sector now trades at a large discount to the market. Historically, the Russell 2000 trades at a premium to the S&P 500. This is justified and rational since over time small caps outperform large caps, albeit with more volatility. If we are correct in our assumption that interest rates and inflation are nearing or at peak levels, we believe you could see multiple expansion drive significant outperformance next year. The stock market is forward looking and if the view becomes “the worst is behind us” this will quickly become a very attractive asset class once again.
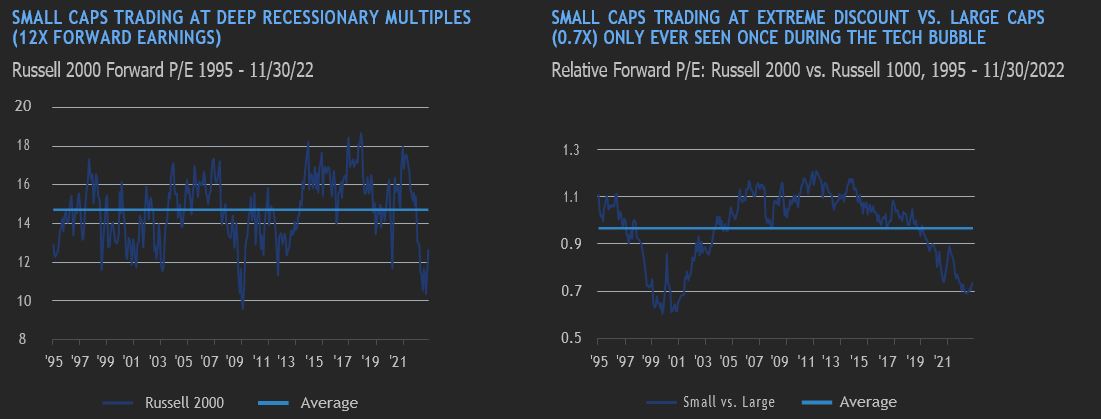
Source: BofA Global Research, Bloomberg Finance L.P.
If the public markets do not close this large valuation disconnect, we believe the private markets will. Many of the large private equity firms have highlighted small caps as a particularly attractive asset class. These firms sit on record amounts of dry powder that they are ready to deploy. It is true some of the smaller private equity firms have been impacted by large banks reducing exposure to the leveraged loan market. We believe this is cyclical and once conditions and interest rates stabilize, banks will be back open for business. During the last quarter of 2022 our portfolios have seen an extremely high level of takeouts, strategic reviews due to unsolicited inbound offers, and Substantial Issuer Bids (SIB) as boards are aware of how significantly undervalued this asset class is.
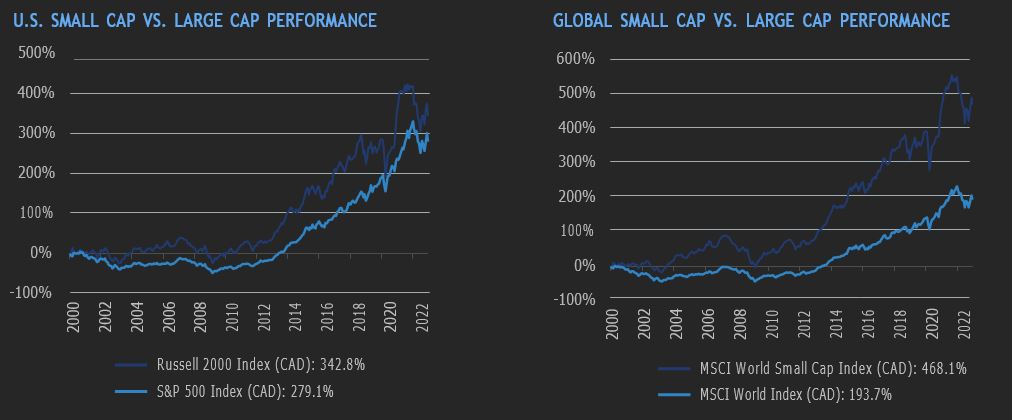
Source: Morningstar Research Inc., as of December 23, 2022.
POSITIONING AND OPPORTUNITIES
Looking into 2023, we are fully invested with <1% cash across our small cap mandates. As bottom-up investors, we believe there are numerous opportunities to buy wide-moat, growing and profitable small cap companies at attractive discounts to our assessment of intrinsic business value. We believe buying these businesses today offers compelling rates of return for discerning, long-term investors.
We have been underweight the consumer discretionary sector, with a particular focus on avoiding larger ticket discretionary purchases as we believe consumers will continue to feel the squeeze of inflation into 2023 and we will continue to see consumption of larger ticket items slow. We are also underweight consumer staples and utilities. While these sectors offer a high degree of stability, we believe these sectors have become expensive relative to faster growing areas of the market that enjoy wider competitive moats.
We have selectively added to energy exposure but remain underweight-to-market-weight across our strategies. We typically avoid taking direct commodity exposure, but we have been increasing weights in service companies where we believe pricing power is beginning to re-emerge after years of under-investment in capacity. We have added significantly to our position in Enerflex (TSX: EFX), a natural gas compression manufacturer and rental business. Enerflex recently completed the acquisition of its largest competitor, Exterran, for a very attractive price relative to the replacement cost of its equipment base, and we believe the deal is well-timed, ahead of a significant upcycle in demand for natural gas compression equipment.
We continue to see value in technology businesses that are trading at attractive free cash flow yields relative to their growth. These businesses benefit from secular tailwinds and the scalable, capital light nature of software products allows for high cash operating margins as the businesses mature. We believe the compounding nature of reinvestment in these businesses will drive meaningful outperformance over the longer term. We believe rates may remain elevated throughout 2023 and, as a result, have avoided exposure to unprofitable businesses that cannot self-fund their growth.
We have been adding to financials exposure but have been avoiding taking on additional consumer credit risk. We have maintained a large position in specialty insurer Trisura (TSX: TSU), which has continued to post strong growth and will see benefit to the float from higher interest rates.
In our global small cap strategy, we are getting more positive on European small cap equities. German equities have been hit very hard by the Russia-Ukraine conflict and ensuing inflationary pressures, and we have been devoting more attention to this market. Additionally, we continue to see ample opportunities in the Nordics and the UK. We believe equity markets in these countries are pricing in a very negative outcome and have been selectively adding exposure.
GLOSSARY OF TERMS:
Correlation: A statistical measure of how two securities move in relation to one another. Positive correlation indicates similar movements, up or down, while negative correlation indicates opposite movements (when one rises, the other falls).
Credit rating/risk – An assessment of the creditworthiness of a borrower in general terms or with respect to a particular debt or financial obligation. Credit risk is the risk of default on a debt that may arise from a borrower failing to make required payment.
Drawdown: Measures the peak-to-trough decline of an investment or, in other words, the difference between the highest and lowest price over a given timeframe.
Duration – A measure of the sensitivity of the price of a fixed income investment to a change in interest rates. Duration is expressed as number of years. The price of a bond with a longer duration would be expected to rise (fall) more than the price of a bond with lower duration when interest rates fall (rise).
Leverage – An investment strategy of using borrowed money – specifically, the use of various financial instruments or borrowed capital – to increase the potential return of an investment.
Return (absolute) – The measure of what an investment returned over a given time period. An investment that rose from $1,000 to $1,100 would have an absolute return of 10%.
Return (relative) – The performance of one investment versus another. The most commonly reported relative returns are mutual fund returns relative to their benchmark indexes.
Volatility – Measures how much the price of a security, derivative or index fluctuates. The most commonly used measure of volatility when it comes to investment funds is standard deviation.
Yield Curve - A line that plots the interest rates of bonds having equal credit quality but differing maturity dates. A normal or steep yield curve indicates that long-term interest rates are higher than short-term interest rates. A flat yield curve indicates that short-term rates are in line with long-term rates, whereas an inverted yield curve indicates that short-term rates are higher than long-term rates.
About the Author

Aubrey Hearn, Senior Vice-President, Portfolio Manager & Lead – US & Small Cap Equities, is the Portfolio manager and Lead of US and Small cap equities. He has over 20 years of experience in the industry. Aubrey started as a research analyst at Sentry Investments in 2005 and progressively worked his way up to Head of Equities in 2019. He was later named lead of US and small cap equities at CI GAM in 2022. Aubrey graduated with an Honours Bachelor of Commerce degree from Memorial University. He also holds the Chartered Financial Analyst (CFA) designation.
*Associated with CI Global Investments Asia Limited, a firm registered with the Securities and Futures Commission of Hong Kong and an affiliate of CI Global Asset Management.
About the Author

Jack Hall, Vice-President, Portfolio Manager & Co-Lead – Small Cap Equities, joined CI GAM in 2012 and brings over 10 years of industry experience. Prior to joining CI GAM, Jack completed Wilfrid Laurier University co-op terms before joining the company full-time. Jack has a Bachelor of Business Administration (Honors) from Wilfrid Laurier University and holds the CFA designation. He is also a CFA society member.
IMPORTANT DISCLAIMERS
This document is provided as a general source of information and should not be considered personal, legal, accounting, tax or investment advice, or construed as an endorsement or recommendation of any entity or security discussed. Every effort has been made to ensure that the material contained in this document is accurate at the time of publication.Market conditions may change which may impact the information contained in this document. Individuals should seek the advice of professionals, as appropriate, regarding any particular investment. Investors should consult their professional advisors prior to implementing any changes to their investment strategies.
The opinions expressed in the communication are solely those of the authors and are not to be used or construed as investment advice or as an endorsement or recommendation of any entity or security discussed.
Certain statements in this document are forwardlooking. Forward-looking statements (“FLS”) are statements that are predictive in nature, depend upon or refer to future events or conditions, or that include words such as “may,” “will,” “should,” “could,” “expect,” “anticipate,” “intend,” “plan,” “believe,” or “estimate,” or other similar expressions.
Statements that look forward in time or include anything other than historical information are subject to risks and uncertainties, and actual results, actions or events could differ materially from those set forth in the FLS. FLS are not guarantees of future performance and are by their nature based on numerous assumptions. Although the FLS contained herein are based upon what CI Global Asset Management and the portfolio manager believe to be reasonable assumptions, neither CI Global Asset Management nor the portfolio manager can assure that actual results will be consistent with these FLS. The reader is cautioned to consider the FLS carefully and not to place undue reliance on FLS. Unless required by applicable law, it is not undertaken, and specifically disclaimed that there is any intention or obligation to update or revise FLS, whether as a result of new information, future events or otherwise.
The author and/or a member of their immediate family may hold specific holdings/securities discussed in this document. Any opinion or information provided are solely those of the author and does not constitute investment advice or an endorsement or recommendation of any entity or security discussed or provided by CI Global Asset Management.
Certain statements contained in this communication are based in whole or in part on information provided by third parties and CI Global Asset Management has taken reasonable steps to ensure their accuracy. Market conditions may change which may impact the information contained in this document.
©CI Investments Inc. 2023. All rights reserved. Published January 4, 2023

About Us
Contact
- 15 York Street, 2nd floor
Toronto, ON M5J 0A3 - Phone: 416‑364‑1145 or
Toll-free: 1‑800‑268‑9374