August 29, 2022
Targeting defense, growth, or yields with CI healthcare ETFs

The global healthcare sector experienced notable tailwinds during the COVID-19 pandemic as demand for vaccines sent the stocks of numerous pharmaceutical companies to all-time highs.
In 2022 so far, the healthcare sector was a relative out-performer compared to the losses suffered by the broad market. The inflationary, rising-interest rate environment created less downside for healthcare stocks compared to hard-hit sectors like technology or consumer discretionary.
The healthcare sector remains an enticing long-term investment for the following three reasons:
- Long-term structural trends such as an aging population, increased healthcare spending, and technological advancements.
- Lower volatility and resilience during bear markets due to evergreen demand for essential services and products.
- Attractive valuations compared to the broad market and other sectors.
The changing future healthcare landscape
A potent combination of an aging global population, coupled with higher spending as a proportion of gross domestic product (GDP) is expected to drive future demand for the healthcare sector's products and services. As seen below, OCED health spending a percentage of GDP jumped strongly in 2020 on a sharp uptrend, while forecasts for old age population is expected to grow over the decades.
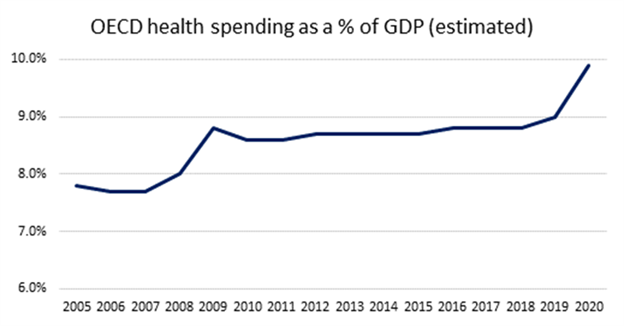
(LHS) Source: OECD Health Statistics 2021
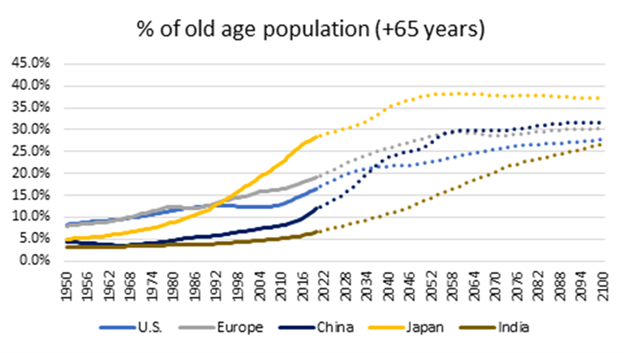
(RHS) Source: United Nations – Population Division
Higher spending drives healthcare supply, while an increasingly aging population drives demand, the intersection of which is predicted to create strong growth in the sector over time. This may be further catalyzed by the speed of technological innovation in the healthcare sector, especially in biotechnology and geonomics.
Playing defense in bear markets
Healthcare sector stocks possess several general characteristics that make them uniquely suitable as defensive investments during turbulent market conditions:
- A lower-than-average beta, which is a measure of volatility and sensitivity relative to the overall market's movements.
- Relative inelastic demand for healthcare products and services due to their essential nature, making the sector less sensitive to economic cycles.
- Stronger balance sheets, and more consistent cashflows compared to more cyclical sectors like technology or consumer discretionary.
These characteristics have helped healthcare sector stocks withstand market downturns noticeably better on a historical basis, as seen below:
Sector | 11/1/2007 - 2/28/2009 | 6/1/2015 - 2/29/2016 | 10/1/2018 - 12/31/2018 | 1/1/2020 - 3/31/2020 |
Health Care | -24.95 | -12.06 | -9.23 | -10.81 |
Consumer Staples | -22.44 | 3.12 | -6.40 | -12.06 |
Utilities | -28.85 | -2.41 | 0.91 | -12.72 |
Communication Services | -30.26 | -0.94 | -6.39 | -17.01 |
Energy | -30.33 | -22.62 | -20.68 | -43.00 |
Information Technology | -42.77 | -8.52 | -17.75 | -12.95 |
Consumer Discretionary | -43.94 | -9.63 | -14.66 | -21.37 |
Materials | -43.09 | -22.24 | -13.03 | -24.02 |
Industrials | -47.51 | -9.65 | -16.31 | -25.22 |
Real Estate | -54.48 | -6.42 | -4.65 | -22.50 |
Financials | -58.50 | -17.80 | -13.15 | -30.16 |
MSCI World | -41.23 | -11.39 | -13.14 | -20.10 |
Source: Morningstar Direct. Based on MSCI World Sector Indices. Performance in local currency. Periods where the MSCI World Index was down 10% or more.
Case in point, the COVID-19 crash of March 2020 saw the MSCI World Index fall by 20.1%, with the energy and financial sectors drawing down by 43% and 30.2% respectively. In contrast, the healthcare sector fell the least out of all 11 sectors by just 10.8%.
Taking advantage of attractive valuations
Despite the poor performance of the markets over the first half of 2022, numerous sectors like technology and communication services still trade at relatively high valuations. As many know, reversion to the mean often occurs and winning sectors rarely outperform and dominate for long.
Comparatively, the healthcare sector currently trades at a fairly attractive valuation. Compared to the MSCI World Index, the MSCI World Health Care Index is currently trading at a substantial discount based on its 12-month forward P/E ratio.
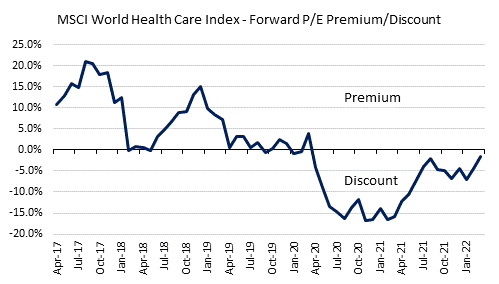
Source: Morningstar Direct, as of March 31, 2022.
The relative under-valuation of the healthcare sector presents a rare opportunity for investors, especially those seeking to implement a sector rotation strategy.
Healthcare investing strategies suitable for all
Exposure to healthcare stocks can be obtained through stock-picking, but this approach can be time-consuming, costly in terms of trading commissions, and subject to idiosyncratic risk (the chance that your stock pick does poorly).
An easier way to diversify is via an ETF, and we have several available for healthcare investors seeking to implement a variety of different investment strategies:
Fund | Ticker | Mgmt. Fee |
FHI.B | 0.65% | |
FHI | ||
FHI.U | ||
CHCL.B | 0.35% | |
CDNA | 0.40% |
Each of the above-noted ETFs targets healthcare sector stocks, but with different strategies depending on the needs of the investor and their investment objectives:
- Healthcare Covered Call ETFs: Investors looking for high yields can use FHI as an alternative to traditional income-generating assets like dividend stocks or corporate bonds. CI's covered call ETFs write call-options on approximately 25% of the portfolio's holdings to ensure participation in upside return potential. The options premiums received can also offset losses somewhat during bear or sideways trading markets.
- Broad Healthcare Index ETFs: Passive, long-term investors seeking to implement a sector rotation strategy or healthcare sector tilt can use CHCL.B. CHCL.B offers one-ticker exposure to a global portfolio of liquid, large-cap healthcare stocks, saving investors the need to manually pick and rebalance holdings.
- Bio-Revolution ETFs: Healthcare investors willing to take on more risk for the possibility of higher growth can target the growing fields of biotechnology and genomics industry via CDNA. Compared to other thematic ETFs of its class, CDNA offers a very competitive management fee.
If you're a healthcare bull, CI GAM has you covered. Our suite of professionally managed ETFs offers a combination of low fees, diversified holdings, and unique strategies suitable for all investment objectives and risk tolerances. Visit our ETF page to learn more.
About the Author

Jaron Liu is a Director of Investment Advisory at CI GAM where he covers the firm’s sub-advised strategies. He serves as a key liaison between the portfolio managers and the sales team, shaping strategy, refining sales positioning, and delivering competitive insights. Prior to joining CI GAM, Jaron worked as an analyst within product management for one of the largest global asset managers where he focused on the firm’s ETF business. Jaron graduated from the University of Waterloo with a degree in Honours Economics and is a CFA Charterholder.
IMPORTANT DISCLAIMERS
The opinions expressed in the communication are solely those of the author(s) and are not to be used or construed as investment advice or as an endorsement or recommendation of any entity or security discussed.
Certain statements contained in this communication are based in whole or in part on information provided by third parties and CI Global Asset Management has taken reasonable steps to ensure their accuracy. Market conditions may change which may impact the information contained in this document.
Commissions, management fees and expenses all may be associated with an investment in exchange-traded funds (ETFs). You will usually pay brokerage fees to your dealer if you purchase or sell units of an ETF on recognized Canadian exchanges. If the units are purchased or sold on these Canadian exchanges, investors may pay more than the current net asset value when buying units of the ETF and may receive less than the current net asset value when selling them. Please read the prospectus before investing. Important information about an exchange-traded fund is contained in its prospectus. The indicated rates of return are the historical annual compounded total returns net of fees and expenses payable by the fund (except for figures of one year or less, which are simple total returns) including changes in security value and reinvestment of all dividends/distributions and do not take into account sales, redemption, distribution or optional charges or income taxes payable by any securityholder that would have reduced returns. ETFs are not guaranteed; their values change frequently, and past performance may not be repeated.
This document is provided as a general source of information and should not be considered personal, legal, accounting, tax or investment advice, or construed as an endorsement or recommendation of any entity or security discussed. Every effort has been made to ensure that the material contained in this document is accurate at the time of publication. Market conditions may change which may impact the information contained in this document. All charts and illustrations in this document are for illustrative purposes only. They are not intended to predict or project investment results. Individuals should seek the advice of professionals, as appropriate, regarding any particular investment. Investors should consult their professional advisors prior to implementing any changes to their investment strategies.
Certain statements in this document are forward-looking. Forward-looking statements (“FLS”) are statements that are predictive in nature, depend upon or refer to future events or conditions, or that include words such as “may,” “will,” “should,” “could,” “expect,” “anticipate,” “intend,” “plan,” “believe,” or “estimate,” or other similar expressions. Statements that look forward in time or include anything other than historical information are subject to risks and uncertainties, and actual results, actions or events could differ materially from those set forth in the FLS. FLS are not guarantees of future performance and are by their nature based on numerous assumptions. Although the FLS contained herein are based upon what CI Global Asset Management and the portfolio manager believe to be reasonable assumptions, neither CI Global Asset Management nor the portfolio manager can assure that actual results will be consistent with these FLS. The reader is cautioned to consider the FLS carefully and not to place undue reliance on FLS. Unless required by applicable law, it is not undertaken, and specifically disclaimed that there is any intention or obligation to update or revise FLS, whether as a result of new information, future events or otherwise.
© 2022 Morningstar Research Inc. All Rights Reserved. The information contained herein: (1) is proprietary to Morningstar and/or its content providers; (2) may not be copied or distributed; and (3) is not warranted to be accurate, complete, or timely. Neither Morningstar nor its content providers are responsible for any damages or losses arising from any use of this information. Past performance is no guarantee of future results.
CI Global Asset Management is a registered business name of CI Investments Inc.
©CI Investments Inc. 2022. All rights reserved.
Published August, 18, 2022

About Us
Contact
- 15 York Street, 2nd floor
Toronto, ON M5J 0A3 - Phone: 416‑364‑1145 or
Toll-free: 1‑800‑268‑9374