October 13, 2026
Situational Anthropology - CI High Income Fund; resolving retirement conundrum for 30 years

KEY SUMMARY POINTS
- Many retirees are look for confidence, not just returns. As investors transition from building wealth to drawing on it, concerns about maintaining their lifestyle, navigating market volatility, and not outliving their savings become more important than maximizing returns.
- Predictable cash flow can help reduce emotional investing decisions. Market downturns early in retirement can lead to panic selling, abandoning long-term plans, and spending anxiety. A consistent income stream can provide the stability and predictability retirees have relied on throughout their working years.
- CI High Income Fund is built to deliver reliable income and long-term growth. By combining dividend-paying equities, infrastructure, real estate, and high-yield bonds, the fund has provided an average annualized yield of 6.25% over 30 years, delivering stable income through major market events while still allowing investors to participate in market growth.
From my reflections on travelling throughout Canada and speaking to Advisors across the country, what struck me about client needs, is that they are typically clear and uncomplicated. Investors don’t want more choices; they want to make fewer decisions. This is the core tenet of the Advisor and client relationship. Situational anthropology, as it relates to investing is understanding how people behave when faced with real-life financial situations, rather than how traditional finance theory assumes they should behave.
In a recent survey conducted by the Canada Pension Plan (CPP), nearly 59% of survey respondents indicated that they fear they will outlive their retirement savings. Fear is most pronounced among survey respondents aged 55 to 59, just before retirement. Once individuals retire, the survey indicates that fear decreases as they settle into retirement. For retirees, one of the most profound situations that they face is the transition from accumulating wealth to then relying on it (and enjoying it!). What history and data tell us, is that the fear of running out of money shapes behaviour more than the actual probability of money. 1
Fear of outliving assets is more emotional than mathematical
When we assess investor behaviour through the lens of anthropology, retirees facing a 25–30-year retirement exhibit remarkably similar behaviours. Preservation becomes more important than accumulation. Many retirees don’t wake up worrying about benchmark returns or Sharpe ratios, they worry about:
- ‘Will I have enough’
- ‘Can I maintain my lifestyle’
- ‘What happens if markets fall’
- ‘Will I become a financial burden to my family’, and (more recently)
- ‘Will I be able to leave enough for my children’
As clients navigate the investing market into retirement, stability becomes more valuable than maximisation and confidence become more important than optimization.
Put simply: Retirees don’t necessarily need the highest return, they need confidence
Sequence of Returns Risk changes Human behaviour
A retiree who experiences a significant market drawdown in the first few years of retirement exhibits noticeably different behaviour to an investor still accumulating wealth. This reaction is rooted in human psychology, where losses tend to feel more significant than gains. As a result, disruptions to income can create anxiety, while market volatility may lead to emotionally driven and potentially unwarranted investment decisions. If we combine these emotions and outcomes, it’s clear that the problem is not simply market volatility. The problem is that anthropologic reactions to volatility can cause:
- Panic selling
- Abandoning of long-term plans
- Overspending fears
- Reduced quality of life
Humans Crave predictability
Throughout history, people have yearned for predictability. The need for certainty is deeply psychological, not merely financial. Retirees who spend 40 years receiving a regular paycheque often seek a replacement source of dependable cash flow into retirement, craving investment solutions that replicate the cadence and predictability of their paycheque. For 40 years, the formula for a typical worker is simple and equates to wealth accumulation.
Work → Receive Paycheque → Pay Bills → Repeat
When one enters retirement, the equation changes. The account balances no longer represent wealth, it represents expenses. As a result, every dollar becomes emotionally charged.
Spend Savings → Hope Portfolio Produces Enough Income → Monitor Account Balance
How do we solve this equation?
Retirees are not merely seeking returns; they are seeking the replacement of a familiar rhythm. After decades of receiving paycheques, many naturally gravitate towards investment solutions that produce regular cashflows. The CI High Income Fund combines dividend paying equities, infrastructure, real estate, and high-yield bonds to generate this regular stream of cash flow. In doing so, it transforms a portfolio from an abstract account balance into something that functions more like a paycheque, helping address the deeply human desire for predictability during an uncertain stage of life.
While Markets Oscillate, Cash Flow in High Income Accumulates
CI High Income Fund has demonstrated a steady and reliable distribution yield through some of the most consequential market events of modern times. Whilst GIC’s have recently offered attractive rates, the reality is that high inflation presented investors in GIC’s with negative real return and no avenue to grow their capital base. As the chart above shows, CI High Income has delivered on average yield of 6.25% on an annualised basis, whilst at the same time affording investors the ability to participate in the upside of markets. Most importantly, the distribution yield of CI High Income outpaces historical inflation by roughly 4% on an annualised basis. What is most impressive however is that the CI High Income fund has delivered stable income to its client through the dot.com era, Global Financial Crises, European Debt Crises and COVID-19 and all other events in between.
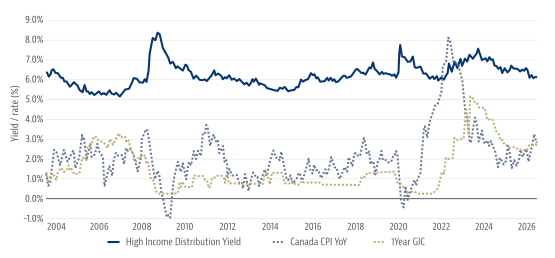
Source: CI Global Asset Management and Bloomberg Finance L.P. as at 31 December, 2025
One Portfolio, Multiple Paydays
Traditional balanced funds are becoming increasingly reliant on capital appreciation, anchored by government bonds and broad equity markets, with Portfolio managers often asking themselves, ‘what stocks should we own’. In its Portfolio construction, instead CI High Income Fund asks, ‘How will our clients get paid’ and we then build a framework of assets around delivering this income requirement to our clients.
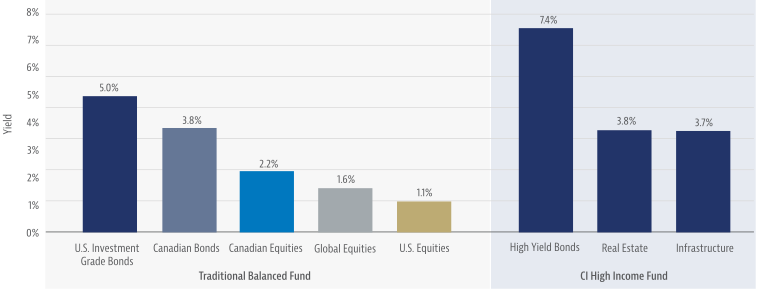
Source: CI Global Asset Management and Bloomberg Finance L.P. as at 31 December, 2025
The High-Income Yield edge
The foundation of the income generation for this fund lies in our allocation to high yield bonds. High yield bonds offer yields that are materially higher than many traditional asset classes. When you begin with a higher cash flow stream, you do not need to rely as heavily on multiple expansion or capital appreciation to achieve attractive returns. When allocating to high yield, avoiding losers matters more then finding winners. Passive high yield exposure owns good credits, and deteriorating credits, the biggest source of alpha in high yield is not hitting home runs but avoiding losers. The CI high yield bond team has a tremendous track record, significantly outperforming the default rates of stated benchmarks.
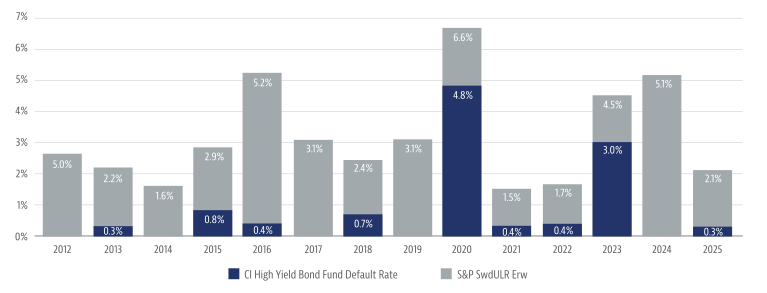
Source: CI Global Asset Management and Bloomberg Finance L.P. as at 31 December, 2025
Proof, Not promises – Delivering what matters
With a nearly 30 years of track record, CI High income has delivered to clients a reliable income and best-in-class drawdown protection. The below illustrates the reliability of the income that is delivered as well as the fund’s ability to deliver capital growth whilst paying a healthy income. At its core, CI High Income is not only solving an investment problem, but also a human problem. For retirees, the greatest challenge is often not achieving the highest return, but maintaining the confidence to stay invested while drawing income from their savings. By combining diversified sources of cash flow, a history of stable distributions and participation in long-term market growth, CI High Income helps replace uncertainty with predictability. After all, retirees do not need more decisions, they need more confidence.
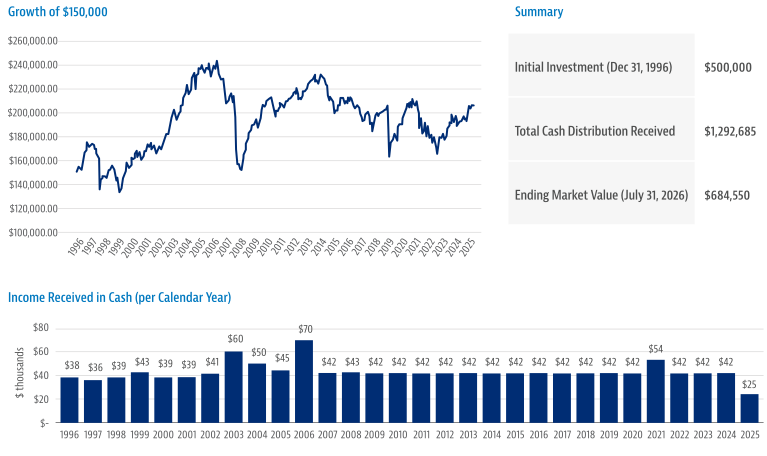
Source: Morningstar Research Inc, as of July, 2026. Series A version of the fund was used. Return measured monthly. The distribution is not guaranteed and may change from payment to payment.
About the Author

Curtis Dwyer is Vice President, Investment Strategy at CI Global Asset Management, where he is responsible for helping advisors and investors navigate markets through portfolio construction insights, macroeconomic analysis, and investment strategy guidance. He works closely with CI GAM’s portfolio management teams to communicate market views, investment positioning, and portfolio solutions across a range of equity, fixed income, and multi-asset strategies. With experience spanning institutional and wealth management environments, Curtis brings a practical perspective to market and investment discussions, helping advisors translate complex economic and market developments into actionable portfolio decisions. His areas of focus include asset allocation, portfolio construction, behavioral finance, retirement income strategies, and the role of diversification in long-term investment success
About the Author

Vienna is an Analyst on the Investment Advisory team at CI Global Asset Management, where she supports multi-asset investment solutions through investment analysis, market research, portfolio insights, and client-focused communications. Prior to joining CI GAM, she spent more than two years at the Alberta Investment Management Corporation (AIMCo), supporting institutional clients representing over $160 billion in assets through investment strategy, product development, pension portfolio analysis, and asset allocation reviews.
Earlier in her career, Vienna held roles in Corporate Banking at CIBC Capital Markets, as well as positions with Altus Group and Invest Nova Scotia, where she developed expertise in capital markets, financial analysis, institutional risk assessment, market intelligence, and client relationship management. Vienna holds a Bachelor of Commerce (Finance) from Dalhousie University and a Certificate in Fintech and Financial Innovation.
APPENDIX:
Standard Performance
| Trailing Performance (August 31, 2026) | YTD | 1-Year | 3-Year | 5-Year | 10-Year | 15-Year | Common Inception* |
|---|---|---|---|---|---|---|---|
| CI High Income Fund (Series F) | 11.2% | 12.5% | 12.8% | 7.5% | 7.1% | 7.4% | 8.3% |
| Quartile Rank | 1+ | 2 | 2 | 1 | 1 | 1 | 1++ |
| Global Neutral Balanced category | 7.5% | 11.5% | 11.5% | 5.7% | 6.1% | 6.6% | 5.2% |
| +/- performance to category | 3.7% | 1.0% | 1.3% | 1.8% | 1.0% | 0.8% | 3.1% |
| # of investments ranked in category | 1,608 | 1,585 | 1,457 | 1,298 | 799 | 353 | 30 |
Source: Morningstar Research Inc., as of August 31, 2026. “+” denotes top decile performance. “++” denotes top percentile performance. Quartile ranks relative to the Global Neutral Balanced category. Unlike mutual funds, Guaranteed Investment Certificates (GICs) are guaranteed by the Canada Deposit Insurance Corporation (CDIC). Details of maximum coverage can be obtained at www.cdic.ca. *Common inception date is December 18, 2001. All performance shown is net of fees and returns are in CAD.
SOURCES
1 Survey came from: 2025 Financial Literacy Month Retirement Survey Results
https://www.cppinvestments.com/wp-content/uploads/attachments/Backgrounder_Retirement-Survey_CPPIB_Oct29_2025_EN.pdf [cppinvestments.com]
IMPORTANT DISCLAIMERS
Commissions, trailing commissions, management fees and expenses all may be associated with mutual fund investments. Please read the prospectus before investing. The indicated rates of return are the historical annual compounded total returns net of fees and expenses payable by the fund (except for figures of one year or less, which are simple total returns) including changes in security value and reinvestment of all dividends/distributions and do not take into account sales, redemption, distribution or optional charges or income taxes payable by any securityholder that would have reduced returns. Mutual funds are not guaranteed, their values change frequently, and past performance may not be repeated.
This document is provided as a general source of information and should not be considered personal, legal, accounting, tax or investment advice, or construed as an endorsement or recommendation of any entity or security discussed. Every effort has been made to ensure that the material contained in this document is accurate at the time of publication. Market conditions may change which may impact the information contained in this document. All charts and illustrations in this document are for illustrative purposes only. They are not intended to predict or project investment results. Individuals should seek the advice of professionals, as appropriate, regarding any particular investment. Investors should consult their professional advisors prior to implementing any changes to their investment strategies.
Certain statements in this document are forward-looking. Forward- looking statements (“FLS”) are statements that are predictive in nature, depend upon or refer to future events or conditions, or that include words such as “may,” “will,” “should,” “could,” “expect,” “anticipate,” “intend,” “plan,” “believe,” or “estimate,” or other similar expressions. Statements that look forward in time or include anything other than historical information are subject to risks and uncertainties, and actual results, actions or events could differ materially from those set forth in the FLS. FLS are not guarantees of future performance and are by their nature based on numerous assumptions. Although the FLS contained herein are based upon what CI Global Asset Management and the portfolio manager believe to be reasonable assumptions, neither CI Global Asset Management nor the portfolio manager can assure that actual results will be consistent with these FLS. The reader is cautioned to consider the FLS carefully and not to place undue reliance on FLS. Unless required by applicable law, it is not undertaken, and specifically disclaimed that there is any intention or obligation to update or revise FLS, whether as a result of new information, future events or otherwise.
Certain statements contained in this communication are based in whole or in part on information provided by third parties and CI Global Asset Management has taken reasonable steps to ensure their accuracy. Market conditions may change which may impact the information contained in this document. Certain names, words, titles, phrases, logos, icons, graphics, or designs in this document may constitute trade names, registered or unregistered trademarks or service marks of CI Investments Inc., its subsidiaries, or affiliates, used with permission. All other marks are the property of their respective owners and are used with permission.
The comparison presented is intended to illustrate the mutual fund’s historical performance as compared with the historical performance of widely quoted market indices or a weighted blend of widely quoted market indices or an-other investment fund. There are various important differences that may exist between the mutual fund and the stated indices or investment fund, that may affect the performance of each. The objectives and strategies of the mutual fund result in holdings that do not necessarily reflect the constituents of and their weights within the comparable indices or investment fund. Indices are unmanaged and their returns do not include any sales charges or fees. It is not possible to invest directly in market indices.
The “Growth of $ 150,000 invested” chart shows the final value of a hypothetical $ 150,000 investment in securities in the specified class of the fund as at the end of the investment period indicated and is not intended to reflect future values or returns on investment in such securities.
© 2026 Morningstar Research Inc. All Rights Reserved. The information contained herein: (1) is proprietary to Morningstar and/or its content providers; (2) may not be copied or distributed; and (3) is not warranted to be accurate, complete, or timely. Neither Morningstar nor its content providers are responsible for any damages or losses arising from any use of this information. Past performance is no guarantee of future results.
Morningstar is an independent organization that groups funds with generally similar investment objectives for comparison purposes and ranks them on a historical basis. Absolute Quartile Rankings are based on total returns only. Morningstar quartile rankings show how well a fund has performed compared to all other funds in its peer group. Each fund within a peer group is ranked based on its performance, and these rankings are broken into quarters or quartiles. Within a group, the top 25% (or quarter) of the funds are in the first quartile, the next 25% are in the second quartile, the next group in the third quartile, and the bottom 25% of funds with the poorest relative performance are in the fourth quartile. The point at which half the funds had better performance and half had worse performance is the median. If 100 funds are being compared, there would be four quartiles of twenty-five funds each. The median would be the fiftieth fund. Rankings are subject to change monthly. For more details on the calculation of Morningstar quartile rankings, please see www.morningstar.ca.
Quartile/percentile rankings are determined by Morningstar Research Inc., an independent research firm. Quartile and percentile rankings are comparisons of the performance of a fund to other funds in a particular category and are subject to change monthly. The quartiles divide the data into four equal segments expressed in terms of rank (1, 2, 3 or 4), and percentiles divide the data into one hundred equal segments expressed in terms of rank (1, 2, 3 … 100). The performance and rankings of other series will differ due to fees and expenses.
The opinion and information provided in this discussion are solely those of the author(s) and are not to be used or construed as personal, legal, accounting, taxation or investment advice, or as an endorsement or recommendation of any entity or security discussed or provided by CI Global Asset Management. Individuals should seek the advice of professionals, as appropriate, regarding any particular investment.
CI Global Asset Management is a registered business name of CI Investments Inc. ©CI Investments Inc. 2026. All rights reserved.
Published September 18, 2026
