June 05, 2026
The Capex Cycle: From Investment to Growth

KEY POINTS
- Capital expenditure (capex) is the critical link between economic growth today and sustainable growth tomorrow.
- AI-related capex has been a key driver of growth in the current cycle, helping to offset weakness in other areas of the economy and generating spillovers across the global economy.
- Early evidence suggests this is beginning to support productivity, profit margins, and earnings. If sustained, this dynamic would point to a more durable and resilient expansion.
Why CAPEX matters?
Capex is the key link between economic growth today and sustainable growth over the medium-term. Demand can support near-term activity, but without corresponding gains on the supply side, stronger demand tends to lead to inflation rather than a sustained increase in real output.
At its core, economic growth is driven by two forces: (1) labour force growth and (2) productivity. With labour force growth slowing across most developed economies, productivity has become increasingly important.
Capex supports productivity not only by increasing the amount of capital available to each worker, but also by enabling the adoption of innovation-driven technologies and processes. In the current cycle, the composition of investment matters. With a significant share tied to AI and digital infrastructure, the potential productivity gains are likely higher than in more traditional investment cycles.
Exhibit 1
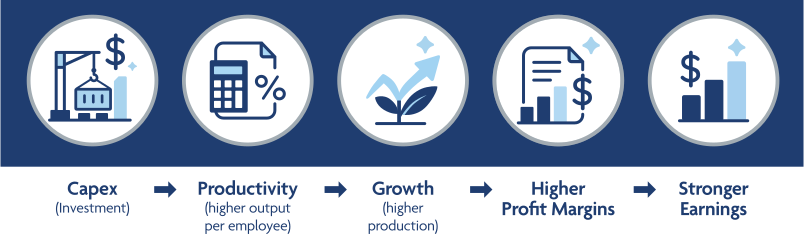
That distinction is important because innovation-led investment tends to have a larger and more persistent impact on productivity, allowing firms to generate more output without a proportional increase in labour or costs. This supports firmer economic growth, higher profit margins, and stronger earnings (Figure 1).
Exhibit 2
U.S. Private Tech Investment*
Source: U.S. Bureau of Economic Analysis (BEA), Macrobond As of April 30, 2026.
*Includes investment in data centers, computer and communications equipment, and software IP.
AI-related capex has been a key driver of current growth
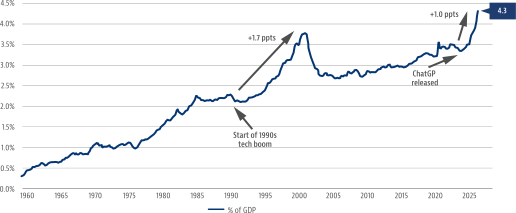
Capex tied to the AI buildout has been a meaningful source of support for economic growth. Private sector tech investment is now north of 4% of U.S. GDP, well beyond what was seen in the 1990’s tech boom (Figure 2).
Rapid growth in recent years has offset softer areas of the economy such as residential investment, which has subtracted from overall growth over the past two years. In this context, capex is not only a key driver of longer-term growth but is also providing an important support to near-term activity.
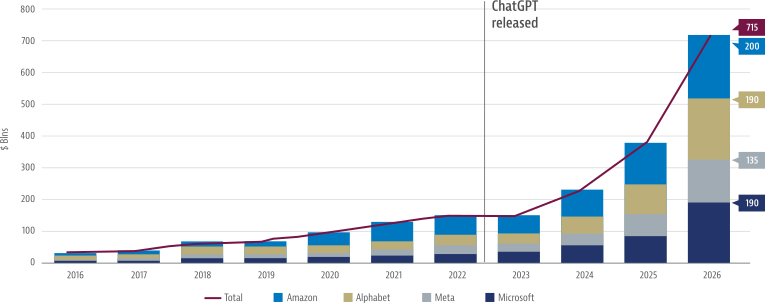
Hyperscaler spending plans also remain elevated, with planned investment for 2026 revised higher and now exceeding $700 billion, suggesting the capex cycle still has further legs to run (Figure 3).
For context, this represents roughly 15-20% of total annual business investment in the US. More importantly, a disproportionate share of the growth in total business investment is being driven by AI-related spending, with capex outside of this sector remaining subdued.
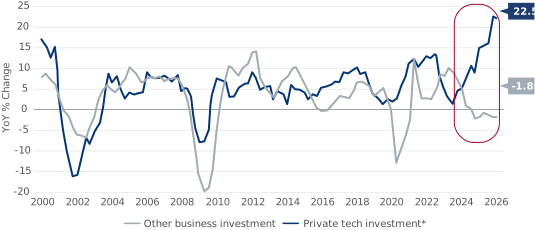
This dynamic is clearly visible in the data. Growth in private tech investment has accelerated sharply in recent years, while other areas of business investment have declined (Figure 4). This divergence underscores the extent to which the current cycle is being driven by AI-related capex, rather than a broad-based improvement in investment activity.
Exhibit 3
U.S. Big-Tech Capital Expenditure
Source: Bloomberg Finance LP. Macrobond As of May 2026, Capex based on fiscal year-end (December for Amazon, Alphabet, and Meta; June for Microsoft
Exhibit 4
U.S. Total Business Investment
Source: U.S. Bureau of Economic Analysis (BEA), Macrobond As of May 28, 2026.
*Includes investment in data centers, computer and communications equipment, and software IP
How does this cycle compare to past U.S. investment booms?
The current capex upswing shares similarities with past U.S. investment booms but differs in important ways.
Historically, major investment cycles have been associated with buildout of foundational infrastructure. The railroad expansion in the 1800s opened up the domestic economy by lowering transportation costs and integrating national markets. Electrification in the early 1900s transformed industrial production by raising efficiency and enabling entirely new forms of output. In both cases, investment was broad-based and largely domestic, with gains spreading across sectors over time.
The technology-driven investment cycle of the late 1990s provides a closer parallel to today’s environment. As in that period, the current cycle is tied to a general-purpose technology. However, today’s cycle stands out in two respects. First, it is more concentrated, with a disproportionate share of incremental investment tied to AI infrastructure, including data centres, computing equipment, and power. Second, it is more global, with a significant share of the physical buildout occurring outside of the U.S., supporting global manufacturing activity and trade.
Early evidence of transmission is emerging
While the full effects of the current capex cycle will take time to materialize, early evidence suggests that the transmission to productivity and ultimately corporate fundamentals may already be underway.
Productivity gains typically lag investment, as firms require time to deploy new capital and integrate new technologies into workflows, and re-optimize processes. As a result, the initial phase of an investment cycle is often characterized by elevated spending, with efficiency gains emerging gradually over time.
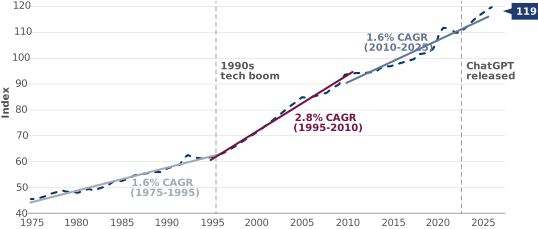
History provides a useful guide. During the technology-driven investment cycle of the late 1990s, productivity growth accelerated meaningfully, rising from roughly 1.6% annualized in the preceding decade to 2.8% annualized over the following 15 years (Figure 5).
Exhibit 5
U.S. Labour Productivity (Output Per Hour)
Source: U.S. Bureau of Labor Statistics(BLS), Macrobond As of May 7, 2026.
While productivity growth has been relatively modest in recent years, the current surge in capex raises the possibility of a similar improvement over time, with very recent data providing tentative signs of a potential inflection higher.
While still early, the recent trajectory of productivity looks increasingly consistent with a world where rising capital intensity is beginning to lift efficiency at the margin. Put differently, firms appear better able to generate incremental output without a proportional increase in labour input.
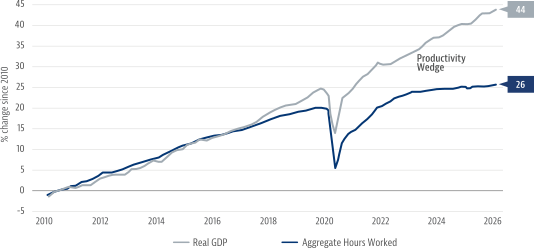
That same message comes through clearly when comparing output to labour input. Since 2020, U.S. real GDP has risen meaningfully faster than aggregate hours worked (Figure 6). The widening gap between total output and total hours worked reinforces the idea that growth has not simply been a function of more labour, but increasingly more output per unit of labour.
These dynamics matter for markets because they provide the foundation for stronger, less inflationary growth. As productivity improves, firms can expand output with less pressure on unit costs, supporting profit margins, and ultimately earnings.
Importantly, markets often price this sequence before it is fully visible in the macro aggregates. If productivity is indeed inflecting higher, this would help explain why earnings and equity performance can remain supported despite pockets of softness in the real economy. And to the extent that stronger equity markets bolster household wealth, that channel can provide an additional tailwind to consumption, reinforcing the expansion.
That said, the sustainability of this dynamic depends on whether the capex impulse persists.
Exhibit 6
U.S. Real GDP vs. Aggregate Hours Worked
Source: U.S. Bureau of Labor Statistics (BLS), U.S. Bureau of Economic Analysis (BEA), Macrobond As of May 8, 2026.
What happens if AI capex slows?
While the current AI investment boom appears to have further room to run, a central risk to the outlook is that capex slows before other parts of the economy re-accelerate.
With investment outside AI-related sectors relatively subdued, the current growth environment remains dependent on continued strength in AI spending. If the rest of the economy remains soft, the downside could be meaningful given the extent to which AI capex has been supporting growth.
In that scenario, a slowdown in AI capex could expose underlying softness, particularly in interest-sensitive areas of the economy such as housing and other cyclical sectors, potentially weighing on both growth and market performance. Given the global nature of the current cycle, any slowdown would likely extend beyond the U.S. economy.
Exhibit 7
U.S. semiconductor imports from Taiwan and Korea

Source: U.S. Census Bureau, Macrobond As of May 5, 2026
Global spillovers are being felt through trade and supply chains
The global footprint of the current capex cycle is evident in trade and supply chains.
Strong demand for semiconductors and advanced equipment is supporting exports from key manufacturing hubs in Asia (Figure 7). At the same time, the buildout of digital infrastructure is increasing demand for energy, materials, and specialized components, creating a broader set of beneficiaries across global supply chains.
The stakes are high for Canada
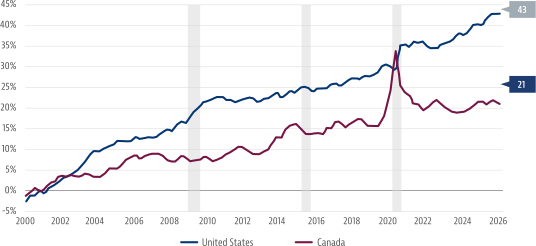
Canada is at an important crossroads given productivity has been challenged for an extended period (Figure 8).
Canada’s growth outlook depends on its ability to increase capex and improve productivity. This can be achieved through policies that support capital formation and reduce frictions to large-scale infrastructure projects.
While the federal government’s increased focus on investment and productivity is a step in the right direction, translating policy intent into sustained increases in capex will be critical to improving the country’s medium-term growth prospects. The key challenge is execution, as turning policy into realized investment will ultimately determine whether productivity growth can meaningfully improve.
Exhibit 8
Labour Productivity (Real GDP Per Hour Worked)
Cumulative % change since 2000
Source: Statistics Canada, U.S. Bureau of Economic Analysis (BEA), U.S. Bureau of Labour Statistics (BLS), Macrobond As of June 3, 2026
Bottom line
The current cycle is increasingly being driven by investment. Capex is already supporting growth, and early evidence suggests it is beginning to feed through to productivity, and earnings.
If sustained, this would point to a more durable expansion with growth increasingly supported by underlying productivity rather than cyclical demand or policy support. In this environment, the economy is better positioned to sustain global growth despite pockets of weakness, and companies able to translate productivity gains into margin expansion are likely to continue to outperform.
View the article: Capital Insights - Macro Update - The Capex Cycle - From Investment to Growth
About the Author

Lorne Gavsie is Senior Vice-President and Head of Macroeconomic & FX Strategy at CI Global Asset Management.
As Senior Vice-President and Head of Macroeconomic & FX Strategy, Lorne Gavsie leads CI Global Asset Management's global macro platform and serves as portfolio manager for the firm's currency strategies. He contributes to the asset allocation process and oversees the firm’s long-term asset class return framework, which informs investment strategy and portfolio construction.
Lorne has more than 25 years of experience in global financial markets, including senior leadership roles in Toronto and London. He holds a joint MBA from the London School of Economics and Political Science, HEC Paris and NYU Stern School of Business, and is a member of the Bank of Canada's Canadian Foreign Exchange Committee. He also serves on the Executive Board of the International Dyslexia Association, Ontario Branch.
About the Author

Neil Shankar is CI Global Asset Management’s Economist, responsible for monitoring key macroeconomic trends and shaping CI GAM’s economic outlook. He actively participates in investment and asset allocation discussions, helping guide decision-making.
A leading contributor to CI GAM’s Capital Insights publication, Neil shares in-depth perspectives on evolving economic conditions. He also frequently engages with stakeholders throughout the organization and externally, helping to deepen understanding of the economic landscape. He is regularly quoted in the press for his views on the economy and markets.
With over 10 years of industry experience, Neil joined CI GAM in 2024 after holding similar roles at other major Canadian financial institutions. Neil holds an MA in Business Economics from Wilfrid Laurier University and a BA (Honours) in Economics from The University of Western Ontario.
IMPORTANT DISCLAIMERS
This document is provided as a general source of information and should not be considered personal, legal, accounting, tax or investment advice, or construed as an endorsement or recommendation of any entity or security discussed. Every effort has been made to ensure that the material contained in this document is accurate at the time of publication. Market conditions may change which may impact the information contained in this document. All charts and illustrations in this document are for illustrative purposes only. They are not intended to predict or project investment results. Individuals should seek the advice of professionals, as appropriate, regarding any particular investment. Investors should consult their professional advisors prior to implementing any changes to their investment strategies. Certain statements in this document are forward-looking. Forward-looking statements (“FLS”) are statements that are predictive in nature, depend upon or refer to future events or conditions, or that include words such as “may,” “will,” “should,” “could,” “expect,” “anticipate,” “intend,” “plan,” “believe,” or “estimate,” or other similar expressions. Statements that look forward in time or include anything other than historical information are subject to risks and uncertainties, and actual results, actions or events could differ materially from those set forth in the FLS. FLS are not guarantees of future performance and are by their nature based on numerous assumptions. Although the FLS contained herein are based upon what CI Global Asset Management and the portfolio manager believe to be reasonable assumptions, neither CI Global Asset Management nor the portfolio manager can assure that actual results will be consistent with these FLS. The reader is cautioned to consider the FLS carefully and not to place undue reliance on FLS. Unless required by applicable law, it is not undertaken, and specifically disclaimed that there is any intention or obligation to update or revise FLS, whether as a result of new information, future events or otherwise. Certain statements contained in this communication are based in whole or in part on information provided by third parties and CI Global Asset Management has taken reasonable steps to ensure their accuracy. Market conditions may change which may impact the information contained in this document. Certain names, words, titles, phrases, logos, icons, graphics, or designs in this document may constitute trade names, registered or unregistered trademarks or service marks of CI Investments Inc., its subsidiaries, or affiliates, used with permission. All other marks are the property of their respective owners and are used with permission. The opinions expressed in the communication are solely those of the author(s) and are not to be used or construed as investment advice or as an endorsement or recommendation of any entity or security discussed. CI Global Asset Management is a registered business name of CI Investments Inc.
©CI Investments Inc. 2026. All rights reserved.
Published June 3rd, 2026.
