August 26, 2026
The Last Honest Money- Strategic Case For Gold & Bitcoin

KEY SUMMARY POINTS
- The Case for Hard Assets Has Never Been Stronger. Rising debt, persistent deficits, and currency dilution continue to support gold and Bitcoin.
- Gold And Bitcoin Are Built for a Changing Monetary Landscape. Scarcity, de-dollarization, and lower real yields reinforce their long-term appeal.
- Small Allocations Can Drive Meaningful Impact. Strategic exposure may enhance diversification, resilience, and long-term return potential.
"By a continuing process of inflation, governments can confiscate, secretly and unobserved, an important part of the wealth of their citizens.“ — John Maynard Keynes
$1.17 trillion. That's what the U.S. government has spent so far on interest payments alone this year. Deficits are now projected to exceed COVID-era emergency levels. These expanding deficits have become structural, ratcheting higher even in "non-emergency" times.
Already Worse Than Covid. CBO Deficit Projections, US$ Trillions
Pre-Iran War baseline; war-related costs not reflected
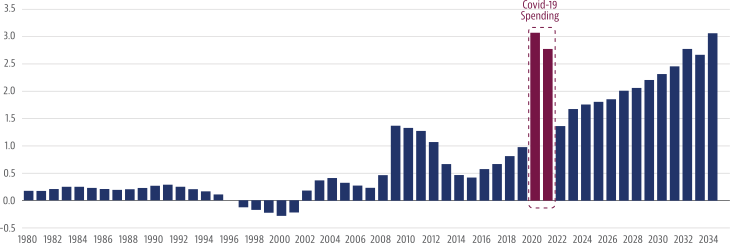
Source: The Wall Street Journal. Congressional Budget Office (CBO). As at March 31, 2026. CI Global Asset Management
Governments facing these dynamics usually have two options. One is the "loud" option: announce painful, politically poisonous cuts and taxes, then try to survive the next election. The other is the "quiet" option: silently dilute the purchasing power of currency in circulation, and let the public pay the bill without ever seeing the invoice. History suggests currencies are quietly diluted long before budgets are bravely balanced. Moody's downgrade of the U.S. credit rating was a verdict on exactly this trajectory.
Paper money bends to government will, and governments have frequently willed printing paper money out of thin air. Hard assets - Gold and Bitcoin - on the other hand, are indifferent to decree, and immune to dilution. To hedge against the next inevitable episode of fiscal indiscipline, we believe traditional All-in-One solutions warrant a strategic allocation to hard assets (Gold and Bitcoin).
The Hard Asset Case in Three Charts
1. Yields Up. Dollar Down.
The 30-year yield measures what the market demands to lend to the government. The Dollar Index measures what that government's currency is worth in return. Since January 2025, the cost of lending to the government has risen while the value of its currency has fallen. In other words, the market is charging more and trusting less.
Yields Up. Dollar Down.
US 30-Year Yield vs. Dollar Index, indexed to 100 (Jan 2, 2025)
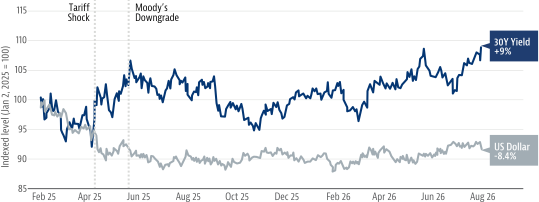
Source: Bloomberg Financial LP. CI Global Asset Management.
2. Gold Trends in Long Terms.
Gold can be volatile over shorter horizons, driven by sentiment. Over decades, it is driven by the structural forces that erode paper money. The current cycle - which began in 2022 - has more entrenched forces behind it than any previous cycle.
Gold Trends in Long Terms.
Current cycle (2022-2026) vs. past cycle (2004-2012), indexed to 100 at day 1
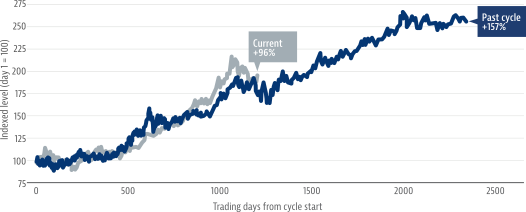
Source: Bloomberg Financial LP. CI Global Asset Management.
3. Bitcoin Counts. Especially When Central Banks Print.
Like gold, the case for Bitcoin is long-term and structural. Bitcoin has a pattern of behaving well every time governments misbehave. What follows maps that pattern against the expansion of the money supply.
Bitcoin Counts. Especially When Central Banks Print.
Bitcoin (indexed, log scale, Jan 2018 = 100) vs. Fed balance sheet (US$ trillions)
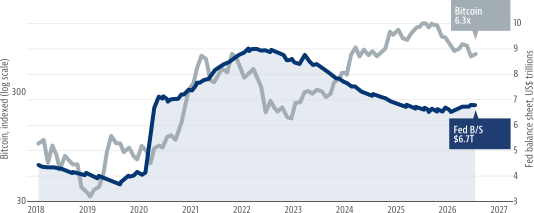
Source: Bloomberg Financial LP, Federal Reserve. CI Global Asset Management.
The Genesis of CI Asset Allocation+ ETFs
Over months, gold and Bitcoin are driven by sentiment. Over years, the structural tailwinds that drive them higher are already in place. That’s the genesis behind CEQP and CBAP.
Four Structural Tailwinds For Gold & Bitcoin
- Debt Monetization. The U.S. owes $39.8 trillion and borrows more every year just to pay the interest. At some point, the only realistic way to manage that burden is to expand money supply, which makes every dollar already in existence worth less. Gold and Bitcoin tend to appreciate in value when paper currency depreciates due to dilution.
- Real Yield Suppression. The other way out is cutting interest rates. When that happens, cash and bonds earn less than the rate of inflation; meaning they quietly lose purchasing power. Investors who understand this move into assets that hold their value. Gold has been that asset for centuries. Bitcoin is increasingly becoming one.
- De-Dollarization. Countries around the world are gradually holding less of their savings in U.S. dollars and more in gold. When the world's largest institutions decide a currency is less trustworthy, they reach for assets no government can print.
- Fixed Supply. Gold’s supply is governed by nature and there will only ever be 21 million Bitcoin. No government, no central bank, and no committee can change that number. In a world of unlimited paper money, that scarcity compounds in value every time the printing press runs.
Why 4% Gold and 4% Bitcoin?
CEQP holds 4% gold and 4% bitcoin. CBAP holds 2.5% each. This allocation optimizes exposure to benefit from structural tailwinds while position-sizing to bear temporary risk scenarios.
- Downside is bounded: A simultaneous -30% drawdown in both Gold and Bitcoin over a quarter would costs CBAP -1.5%.
- Upside is open: When Gold & Bitcoin move, they move decisively. Fueled by the structural tailwinds discussed in this writing, we expect Gold and Bitcoin to contribute meaningfully to long-term portfolio returns.
- Diversification is real: Optimized allocation to Gold and Bitcoin – as is the case with CEQP & CBAP - tend to create synergy on an overall portfolio level, creating the potential for improved risk adjusted returns.
Upgrade your All-in-One Allocation.
If you, like us, believe the forward risks demand proactive allocation to Gold & Bitcoin, our CI Asset Allocation+ Suite, available in balanced and all-equity profiles, is uniquely positioned to provide that exposure through a low-cost, Client Relationship Model Phase 3 (CRM3) friendly, set-it-and-forget-it solution.
CI Balanced + Asset Allocation ETF Fund- ETF Series
(Ticker: CBAP)

CI Balanced + Asset AllocatioN ETF Fund- ETF Series
(Ticker: CEQP)

To open this article in a shareable format, click here.
About the Author

Adam Bahram is Vice President, Institutional Portfolio Manager at CI Global Asset Management, where he oversees the firm’s asset allocation strategies. In this role, Adam is responsible for providing portfolio insights to institutional and advisor audiences while supporting the positioning and growth of CI GAM’s investment solutions.
Adam brings extensive experience in buy-side research analysis, asset allocation, and portfolio management. Prior to joining CI GAM, he served as an Associate Client Portfolio Manager on the Asset Allocation team at TD Asset Management, where he developed expertise in constructing and managing investment strategies. He has also served on the investment committee of a wealth management firm.
Adam holds a Master of Finance from the Sobey School of Business at Saint Mary’s University and is a CFA charter holder.
GLOSSARY:
Drawdown: Measures the peak-to-trough decline of an investment or, in other words, the difference between the highest and lowest price over a given timeframe.
Return (risk-adjusted): A measure of investment performance taking into consideration how much risk/volatility was assumed to generate it. Consider two investments, both of which return 10% over a given time period. The investment with the greater risk-adjusted return would be the one that experienced less price fluctuation. Two of the most commonly used measures of risk adjusted returns are Sharpe and Sortino ratios.
Volatility: Measures how much the price of a security, derivative, or index fluctuates. The most commonly used measure of volatility when it comes to investment funds is standard deviation.
IMPORTANT DISCLAIMERS
Commissions, management fees and expenses all may be associated with an investment in exchange-traded funds (ETFs). You will usually pay brokerage fees to your dealer if you purchase or sell units of an ETF on recognized Canadian exchanges. If the units are purchased or sold on these Canadian exchanges, investors may pay more than the current net asset value when buying units of the ETF and may receive less than the current net asset value when selling them. Please read the prospectus before investing. Important information about an exchange-traded fund is contained in its prospectus. ETFs are not guaranteed; their values change frequently, and past performance may not be repeated.
This communication is published by CI Global Asset Management (“CI GAM”). Any commentaries and information contained in this communication are provided as a general source of information and should not be considered personal investment advice. Facts and data provided by CI GAM and other sources are believed to be reliable as at the date of publication.
Certain statements contained in this communication are based in whole or in part on information provided by third parties and CI GAM has taken reasonable steps to ensure their accuracy. Market conditions may change which may impact the information contained in this document.
Information in this communication is not intended to provide legal, accounting, investment or tax advice, and should not be relied upon in that regard. Professional advisors should be consulted prior to acting based on the information contained in this communication.
The author and/or a member of their immediate family may hold specific holdings/securities discussed in this document.
Any opinion or information provided are solely those of the author and does not constitute investment advice or an endorsement or recommendation of any entity or security discussed or provided by CI Global Asset Management. This document is for use by Canadian accredited investors only.
You may not modify, copy, reproduce, publish, upload, post, transmit, distribute, or commercially exploit in any way any content included in this communication. You may download this communication for your activities as a financial advisor provided you keep intact all copyright and other proprietary notices. Unauthorized downloading, re-transmission, storage in any medium, copying, redistribution, or republication for any purpose is strictly prohibited without the written permission of CI GAM.
CI Global Asset Management is a registered business name of CI Investments Inc.
©CI Investments Inc. 2026. All rights reserved.
